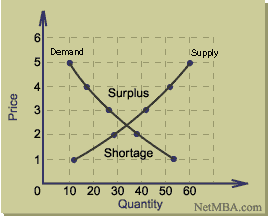
The market price of a good is determined by both the supply and demand for it. In 1890, English economist Alfred Marshall published his work, Principles of Economics, which was one of the earlier writings on how both supply and demand interacted to determine price. Today, the supply-demand model is one of the fundamental concepts of economics. The price level of a good essentially is determined by the point at which quantity supplied equals quantity demanded. To illustrate, consider the following case in which the supply and demand curves are plotted on the same graph.
Supply and Demand
 On this graph, there is only one price level at which quantity demanded is in balance with the quantity supplied, and that price is the point at which the supply and demand curves cross.
The law of supply and demand predicts that the price level will move toward the point that equalizes quantities supplied and demanded. To understand why this must be the equilibrium point, consider the situation in which the price is higher than the price at which the curves cross. In such a case, the quantity supplied would be greater than the quantity demanded and there would be a surplus of the good on the market. Specifically, from the graph we see that if the unit price is $3 (assuming relative pricing in dollars), the quantities supplied and demanded would be:
Quantity Supplied = 42 units
Quantity Demanded = 26 units
Therefore there would be a surplus of 42 - 26 = 16 units. The sellers then would lower their price in order to sell the surplus.
Suppose the sellers lowered their prices below the equilibrium point. In this case, the quantity demanded would increase beyond what was supplied, and there would be a shortage. If the price is held at $2, the quantity supplied then would be:
Quantity Supplied = 28 units
Quantity Demanded = 38 units
Therefore, there would be a shortage of 38 - 28 = 10 units. The sellers then would increase their prices to earn more money.
The equilibrium point must be the point at which quantity supplied and quantity demanded are in balance, which is where the supply and demand curves cross. From the graph above, one sees that this is at a price of approximately $2.40 and a quantity of 34 units.
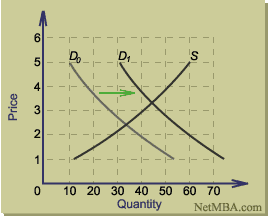
To understand how the law of supply and demand functions when there is a shift in demand, consider the case in which there is a shift in demand:
Shift in Demand
 In this example, the positive shift in demand results in a new supply-demand equilibrium point that in higher in both quantity and price. For each possible shift in the supply or demand curve, a similar graph can be constructed showing the effect on equilibrium price and quantity. The following table summarizes the results that would occur from shifts in supply, demand, and combinations of the two.
Result of Shifts in Supply and Demand
Demand | Supply | Equilibrium | Equilibrium |
+ |
| + | + |
- |
| - | - |
| + | - | + |
| - | + | - |
+ | + | ? | + |
- | - | ? | - |
+ | - | + | ? |
- | + | - | ? |
In the above table, "+" represents an increase, "-" represents a decrease, a blank represents no change, and a question mark indicates that the net change cannot be determined without knowing the magnitude of the shift in supply and demand. If these results are not immediately obvious, drawing a graph for each will facilitate the analysis.
Source: www.netmba.com
Hi Dear. i like you blog post. It's contain awesome information. it's help me a lot. Thanks for sharing it.
ReplyDeleteOnline MBA