Quantitative Approach:-
It involves the use of quantitative techniques to improve decision making.
Branches in the Quantitative Management Viewpoint:
1. Management science / operations research:-
It is an approach aimed at increasing decision effectiveness through the use of complicated mathematical models and statistical methods.
2. Operations Management:-
It is the function or field of expertise that is primarily responsible for the production and delivery of an organization’s products and services.
3. Management information systems (MIS):-
It is the name often given to the field of management that
focuses on designing and implementing computer-based information systems for use by management

This school of thought or view point about management includes those major ideas about managing and organizations that have emerged since the 1950s.
The systems theory approach:-
It is based on the idea that organizations can be visualized as systems of interrelated parts or subsystems that operate as a whole in search of common goals.
Contingency Theory:-
It is the view that appropriate managerial action depends on the particular parameters of each situation.
Emerging views:
A. Globalization.:-
Managers in all types and sizes of organizations are faced with the opportunities and challenges of globalization.
B. Entrepreneurship:-
It refers to the process whereby an individual or a group of individuals uses organized efforts and means to pursue opportunities to create value and grow by fulfilling wants and needs through innovation and uniqueness.
C. Managing in an E-Business World:-
1. E-business (electronic business)
2. E-commerce (electronic commerce)
D. Need for Innovation and Flexibility.
E. Quality Management Systems.
1. Total quality management:-
It is a philosophy of management that is driven by customer needs and expectations and focuses on continual improvement in work processes
F. Learning Organizations and Knowledge Management.
1. A learning organization is one that has developed the capacity to continuously adapt and change.
2. Knowledge management involves cultivating a learning culture where organizational members systematically gather knowledge and share it with others to achieve better performance.
G. Theory Z : William Ouchi’s:-
Theory Z combines positive aspects of American and Japanese management into a modified approach aimed at increasing managerial effectiveness.




 Most people think it's because the holidays are a slow time for business and that people don't want to get involved in a new business venture at this time. But really the main reason for this slow-down in business is because most people just stop doing business during the holidays. But survey networks know that the holidays are really a perfect time to do business, and that they just need to adjust their marketing strategies a bit to fit the season.

 Opportunity cost is useful when evaluating the cost and benefit of choices. It often is expressed in non-monetary terms. For example, if one has time for only one elective course, taking a course in microeconomics might have the opportunity cost of a course in management. By expressing the cost of one option in terms of the foregone benefits of another, the marginal costs and marginal benefits of the options can be compared.
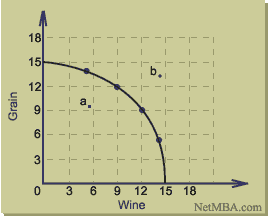 The PPF shows all efficient combinations of output for this island economy when the factors of production are used to their full potential. The economy could choose to operate at less than capacity somewhere inside the curve, for example at point a, but such a combination of goods would be less than what the economy is capable of producing. A combination outside the curve such as point b is not possible since the output level would exceed the capacity of the economy.
 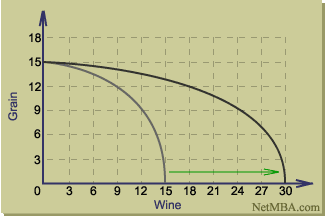 In the above diagram, the new technique results in wine production that is double its previous level for any level of grain production.
 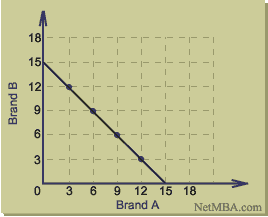 Note that to increase production of Brand A from 0 to 3000 bottles, the production of Brand B must be decreased by 3000 bottles. This opportunity cost remains the same even at the other extreme, where increasing the production of Brand A from 12,000 to 15,000 bottles still requires that of Brand B to be decreased by 3000 bottles. Because the two products are almost identical in this case and can be produced equally efficiently using the same resources, the opportunity cost of producing one over the other remains constant between the two extremes of production possibilities.
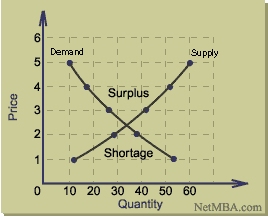 On this graph, there is only one price level at which quantity demanded is in balance with the quantity supplied, and that price is the point at which the supply and demand curves cross.
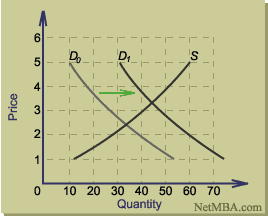 In this example, the positive shift in demand results in a new supply-demand equilibrium point that in higher in both quantity and price. For each possible shift in the supply or demand curve, a similar graph can be constructed showing the effect on equilibrium price and quantity. The following table summarizes the results that would occur from shifts in supply, demand, and combinations of the two.
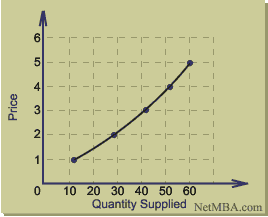 As with the demand curve, the convention of the supply curve is to display quantity supplied on the x-axis as the independent variable and price on the y-axis as the dependent variable.
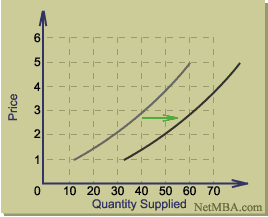 There are several factors that may cause a shift in a good's supply curve. Some supply-shifting factors include:
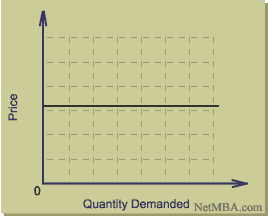
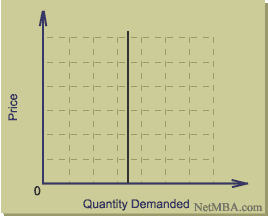
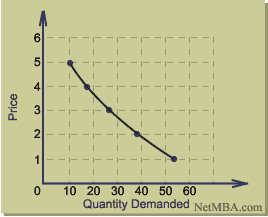 By convention, the demand curve displays quantity demanded as the independent variable (the x axis) and price as the dependent variable (the y axis).
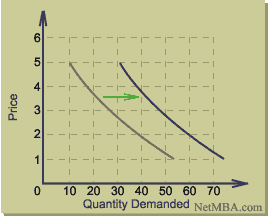 A number of factors may influence the demand for a product, and changes in one or more of those factors may cause a shift in the demand curve. Some of these demand-shifting factors are: